PowerSchool reporting · A practical review workflow
A behavior referral tells you what was recorded. It does not, by itself, tell you whether the student is also missing assignments, struggling in one course or absent from particular classes.
That is why a useful student review goes beyond counting behavior entries. The next question is usually, “What else should we look at before we decide how to follow up?”
PureData’s group reporting feature for PowerSchool puts behavior, attendance, grades and assignments in one report. Here is a practical way to use that information in a grade-level, advisory or student support meeting.
1. Choose the group and the question
Start with the students your team is responsible for reviewing. That might be a grade level, a course section or a user-defined group such as an advisory group or team.
Then name the question. “How is Grade 9 doing?” is a broad starting point. “Which Grade 9 students need a conversation about missing work, and what other context should we check?” gives the meeting a clearer purpose.
In the Behavior Points Summary by Group report, select the relevant group rather than rebuilding the same student list in a separate spreadsheet. Keep the group consistent when you return for the next review, and note any membership changes.
2. Check the dates before comparing numbers
The figures in a combined report do not necessarily cover the same period. In this report, behavior points and log entries use the selected reporting dates, while grades and assignments use the school year shown. The student grade view also lets you switch between available terms.
That distinction matters. Missing assignments shown beside a week’s behavior entries should not automatically be described as “this week’s missing assignments.” Read the scope labels first, then make a comparison that the underlying records support.
3. Use the summary to decide where to look
The overview puts several signals next to each other: behavior log counts, positive and negative points, daily and class meeting attendance, average grades and missing assignments. Charts add grade distribution, weekly attendance patterns, assignment completion and log entry types.
Use those summaries to choose the next question. A group average can hide a wide range of individual grades. A daily attendance rate and a class meeting attendance rate describe different views of attendance. A behavior count tells you how many entries were recorded; you still need to read the entries to understand them.
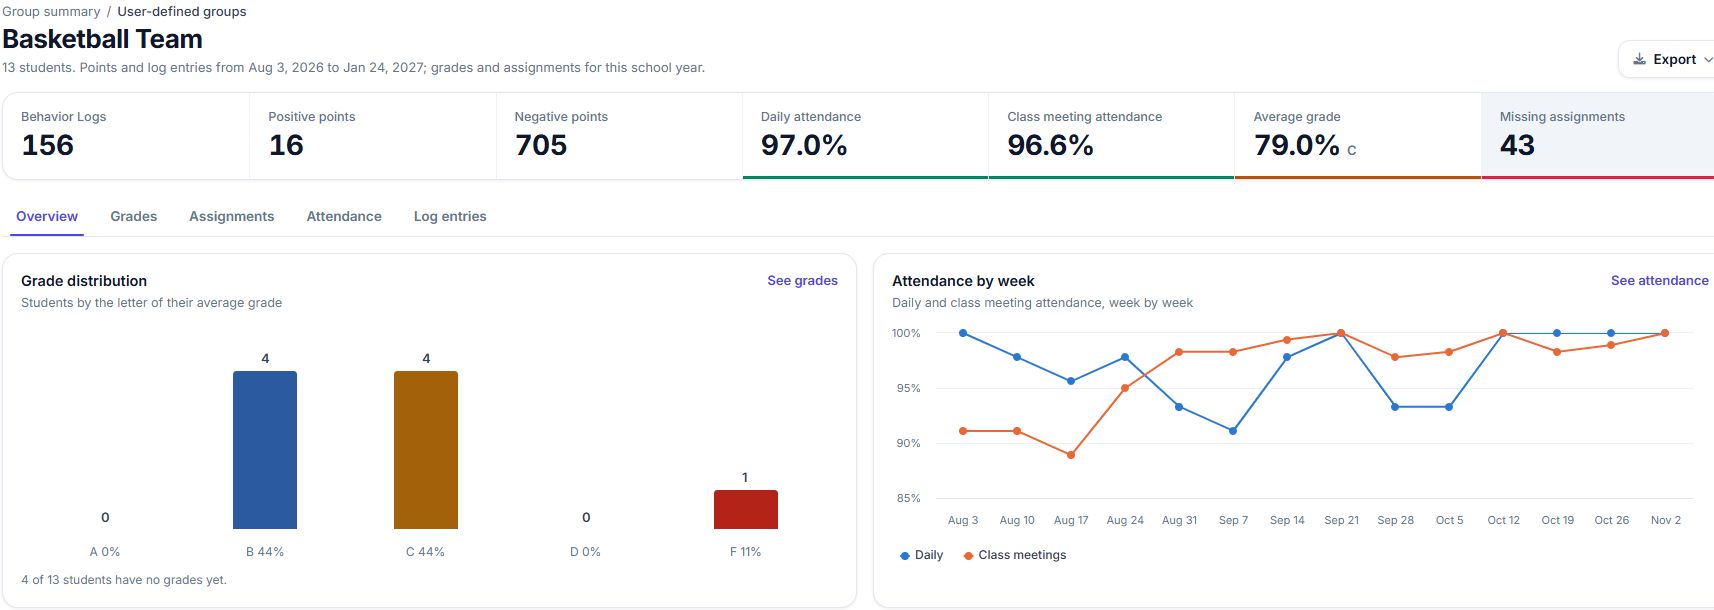
Also check what is missing. If some students do not yet have grades, a grade chart is not a complete academic picture of the whole group. The demo report explicitly labels students without grades.
4. Open the records behind the student’s summary
Once you have identified a question, use the student list to open the relevant detail view:
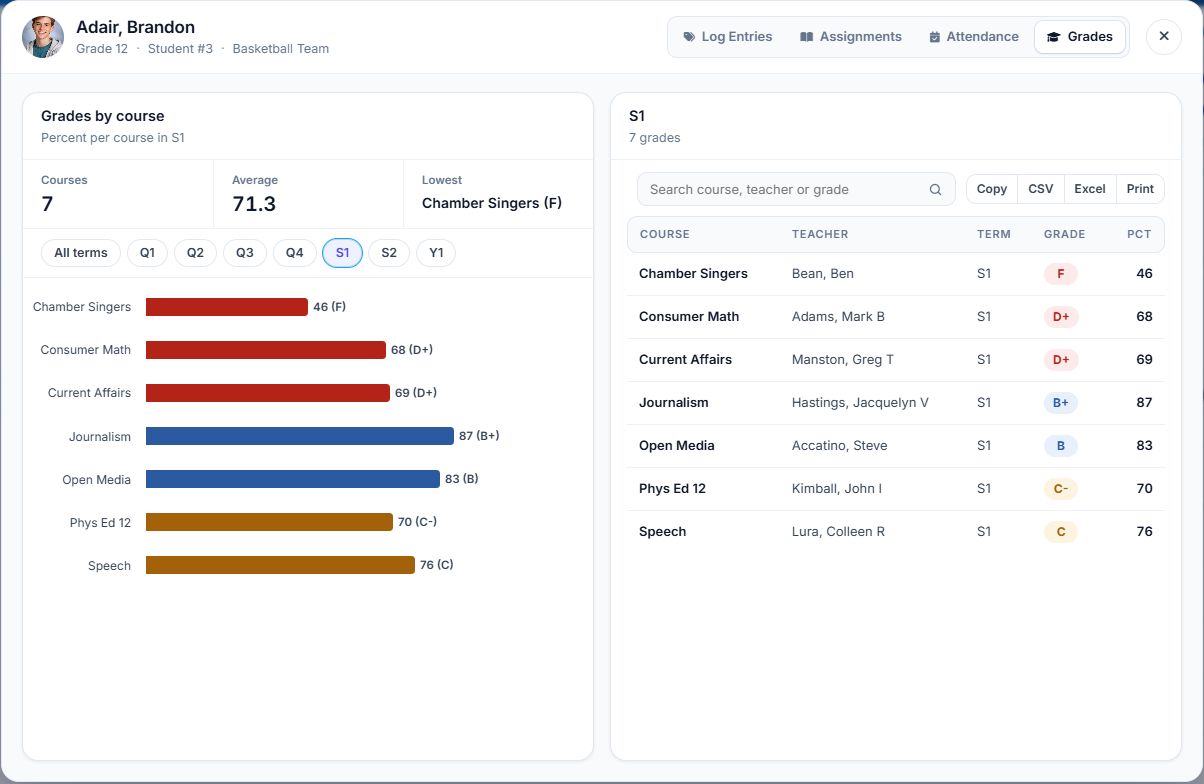
- Grades: inspect individual course grades and the selected term. Is the concern concentrated in one course or visible across several?
- Assignments: review assignment records and filter by course. Which records need a closer check with the teacher?
- Attendance: distinguish daily attendance from meeting attendance and inspect the dates and codes.
- Log entries: review the entry types and individual records behind the behavior totals. Keep log entries and incidents distinct in your discussion.
The point is to gather context. A pattern across these views can suggest a useful question for staff, a student or a family; it does not establish why something happened.
5. What the demo example actually tells us
In the screenshot, the selected group has 13 students, a 79% average grade and 43 missing assignments. The grade distribution also notes that four students have no grades yet.
Those figures do not tell us that every student is performing at 79%, or that all 43 missing assignments belong to one student. They give us a reason to open the student list, inspect course and assignment details, and check whether the records are complete.
Similarly, a difference between daily and meeting attendance is a prompt to inspect dates and attendance codes. It is not enough, on its own, to label a student’s behavior or explain a grade.
6. End with a specific follow-up
Before leaving the report, turn the discussion into a short action your team can carry out. For example:
- Ask a course teacher to verify particular missing assignment records.
- Ask the attendance team to check the dates and codes discussed in the meeting.
- Arrange a student check-in with the staff member who already supports that student.
Record who owns the follow-up, what they need to check and when the team will return to it. These are suggested meeting practices, rather than actions the report performs automatically.
At the next review, use the same group and be explicit about any changes to dates, terms or membership. That makes it easier to discuss what changed without comparing different populations or periods by accident.
Try the workflow in a focused demo
Group summaries are most useful when they lead to a better question about a student. PureData’s Behavior Management Plugin connects those two views inside PowerSchool SIS.
Explore group reporting and student drill-downs →
Request a demo for your school →