
PureData · Behavior Management Plugin
PowerSchool group reporting.
Student context, one click away.
Bring behavior, attendance, grades and assignments into one group view. Then open the student details behind the numbers—without leaving the report.
A reporting feature within PureData’s Behavior Management Plugin for PowerSchool SIS.
Start with the question, not a spreadsheet
How is this group doing—and who needs a closer look?
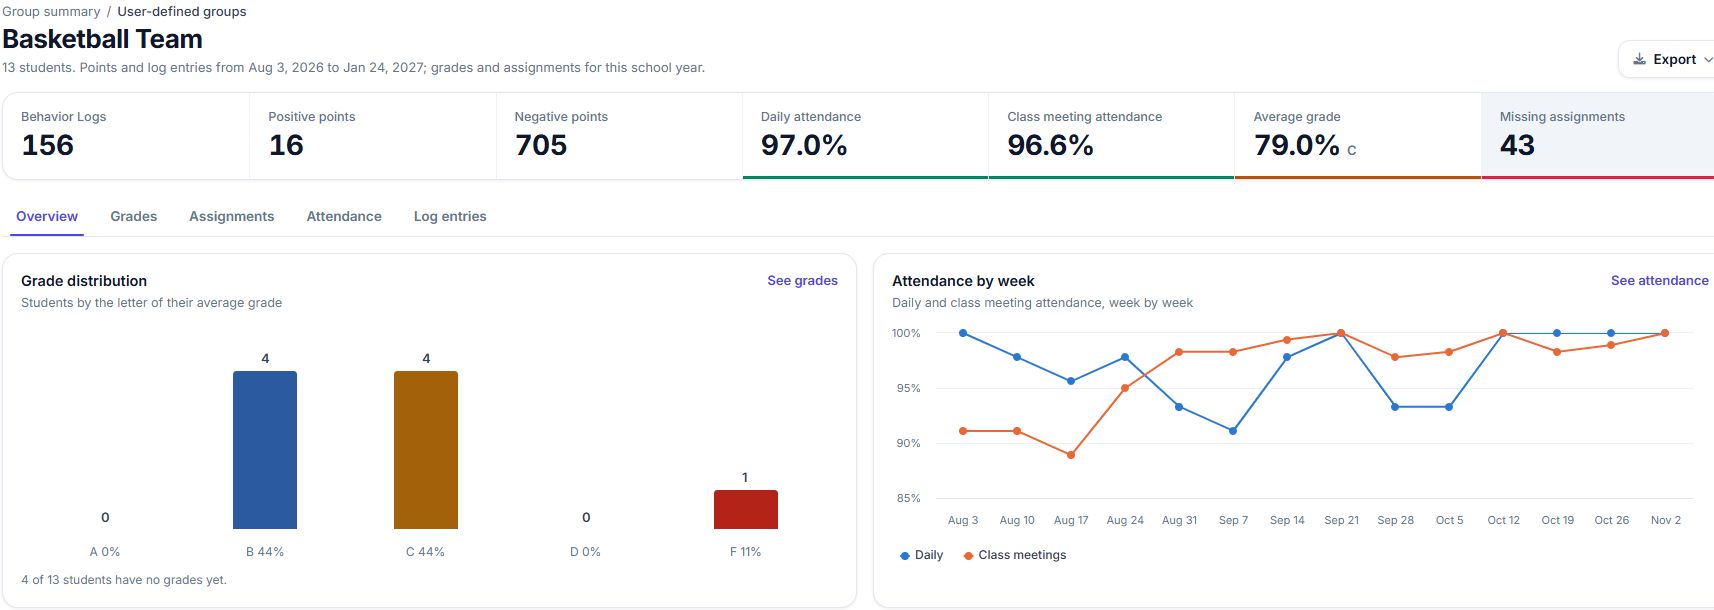
A grade-level average is useful, but it is only a starting point. This report keeps the group summary and individual records connected, so a team can investigate what sits behind a chart before deciding what to do next.
Choose your group
Select a user-defined group, grade level or course section. Review an advisory group, a team or a class using the groups available in your PowerSchool setup.
Read the overview
See behavior logs and points alongside daily and class meeting attendance, average grades and missing assignments. Use the charts to find the area you want to explore.
Open the student detail
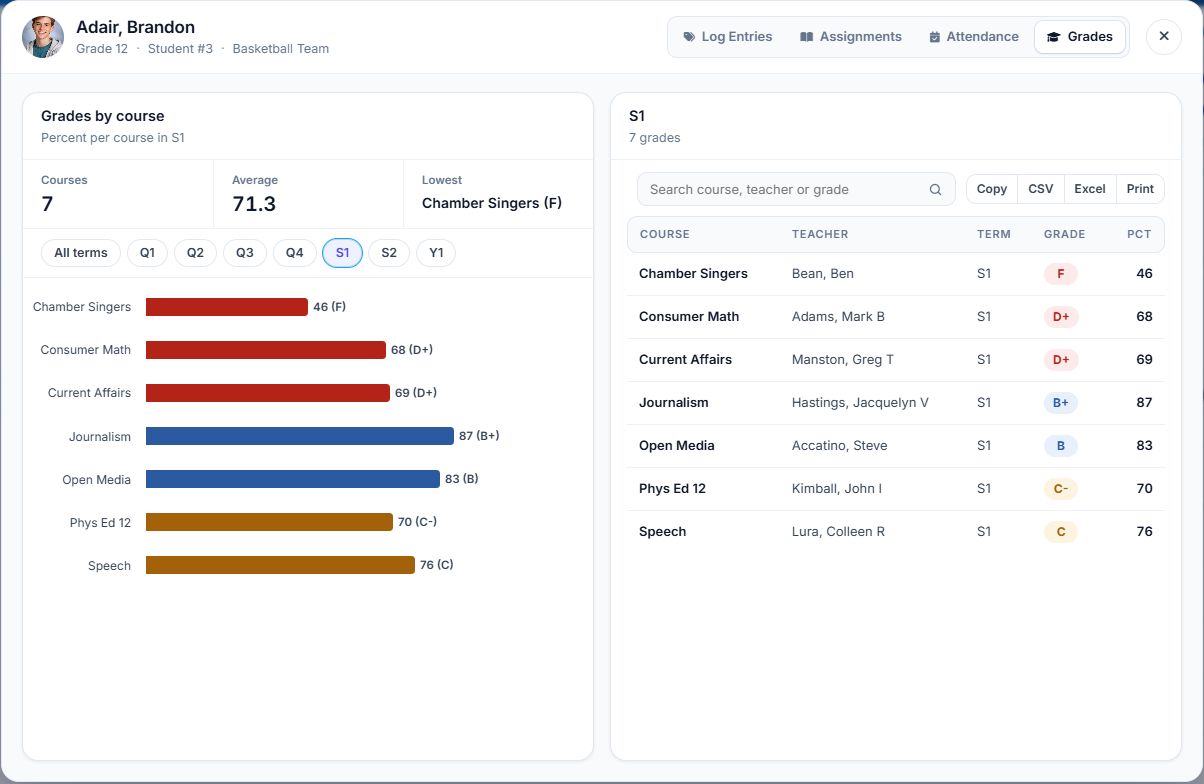
Move from the group’s student list to individual grades, assignments, attendance or log entries. Check the underlying records rather than relying on an average alone.
The detail behind the summary
One student. Four ways to look closer.
When a number raises a question, open the relevant student view from the group’s student list.
- Grades: compare course grades and switch between available terms.
- Assignments: review assignment records and filter by course.
- Attendance: switch between daily and meeting attendance, with attendance-code detail.
- Log entries: explore entry types and the records behind the behavior summary.
The report brings context together. Your staff still review the records and decide the appropriate follow-up.
More than a behavior count
Put related information side by side
The overview combines several views of the same group. Each answers a different question; none needs to stand on its own.
Behavior & points
Review log counts, positive and negative points, and the distribution of log entry types.
Daily & meeting attendance
See both attendance rates and weekly patterns, then inspect individual attendance records.
Grades by group & course
Start with the group average and grade distribution. Open a student’s course grades when you need more detail.
Assignment completion
Review on-time, late, missing and exempt assignments, along with the assignments most often missing.
Focused filters
Apply the report’s date, behavior, referral administrator and dean filters to focus your review.
Details you can share
Use the available table controls to copy, export to CSV or Excel, or print the records you are reviewing.
Built around real school conversations
Go into the next check-in with context
Grade-level reviews
Start with a grade’s summary, then open the records that need discussion. Keep the conversation connected to individual students.
Student support meetings
Look at behavior, attendance and academic information together when preparing questions for a student or family conversation.
Advisory & team check-ins
Use a defined student group to review the learners your team supports, rather than rebuilding that list for each meeting.
Want a practical review routine? Read our guide to reviewing behavior, attendance and grades together in PowerSchool.
Common questions
Before you book a demo
What is PowerSchool group reporting in PureData?
It is the Behavior Points Summary by Group report in PureData’s Behavior Management Plugin for PowerSchool SIS. It combines group summaries for behavior, attendance, grades and assignments with access to individual student details.
Which student groups can I use?
The report supports user-defined groups and predefined options such as grade levels and course sections. A demo can show how the available groups fit your school’s review process.
Can I open an individual student’s records?
Yes. From the group’s student list, open grades, assignments, attendance or log entries. Grade views include course-level information and term filters; attendance views distinguish daily and meeting attendance.
Do all numbers use the same date range?
No. Points and log entries follow the selected reporting dates, while grades and assignments use the school year shown in the report. Check the date and term labels in each view when comparing information.
Is this a separate analytics product?
This page describes a reporting feature within PureData’s Behavior Management Plugin for PowerSchool SIS. Contact PureData to confirm the reporting options and licensing for your school or district. You can also explore the full Behavior Management Plugin.
Live demo
See student group reporting in action
Tell us what your school wants to review. We’ll show you how to compare grades, classes or custom groups and open the student details behind the numbers.
Please leave student names and records out of your message.