Taking a road trip can be a lot like navigating a school year. Imagine you’ve planned a week-long road trip across the country with your family. Before the trip starts, you’ve prepared with almost everything in mind – the route is mapped out, essentials are packed, you’ve got the perfect playlist to go with each day’s events, and you’ve ensured your car is ready for the road with an oil change. The day comes to get everyone in the car, and you begin the journey. You hit construction on Day 2, which causes a two-hour delay in traffic, but your GPS helps you find an alternative route, and you get back on schedule. Days 3 & 4 go well, and you’ve been tracking your gas mileage to ensure your car is doing well. You’re beginning to think you’re going to make it to your destination on time with no problems.
That is until you start your car on Day 5 and see the indicator light for low tire pressure. One of your new tires needs a patch. You remember you saw an auto shop a couple of miles up the road, and if you go now, you’ll be able to get that fixed and be back on the road with enough time to make it to your destination for the night. On Day 6, you let your teenager take the wheel for a little bit and quickly realize you need to keep an eye on the speedometer if you want to avoid any speeding tickets for the day. And by Day 7, you’ve made it to your final destination!
Now think about taking that road trip without any of the mentioned technology – no GPS, just a paper map. No indicator lights, you have to trust your car is working well until a tire pops. No speedometer, you have to estimate your speed and hope you’re on track. Is the road trip still possible? Absolutely! Can you anticipate potential challenges and respond quickly? Not really. At least not as well as you could with the information your dashboard provides you.
And this is what educators need to navigate their school year – an educational dashboard. Advisors or homeroom teachers are often tasked with guiding a group of students through the school year with the goal of providing targeted support toward promotion and graduation. And so, even with all of the in-depth preparation and planning that goes into a school year, unanticipated challenges are bound to come up. Advisors and educators in a variety of circumstances need to be able to access the information critical to their student’s success quickly and easily so that they can respond effectively.
Advisory dashboards to analyze student progress
When you think about what you would want to include on your advisory dashboard to ensure your students are on track, a number of metrics might come to mind – GPA, number of Fs, overall attendance, first-period attendance, summative assessment scores, number of detentions, behavioral logs. Different metrics may be prioritized differently depending on your school context or your role in your school. But regardless of role, a central location where a student’s academic, attendance, and/or behavioral data is presented helps an advisor or educator understand student progress holistically and then investigate trends more specifically.
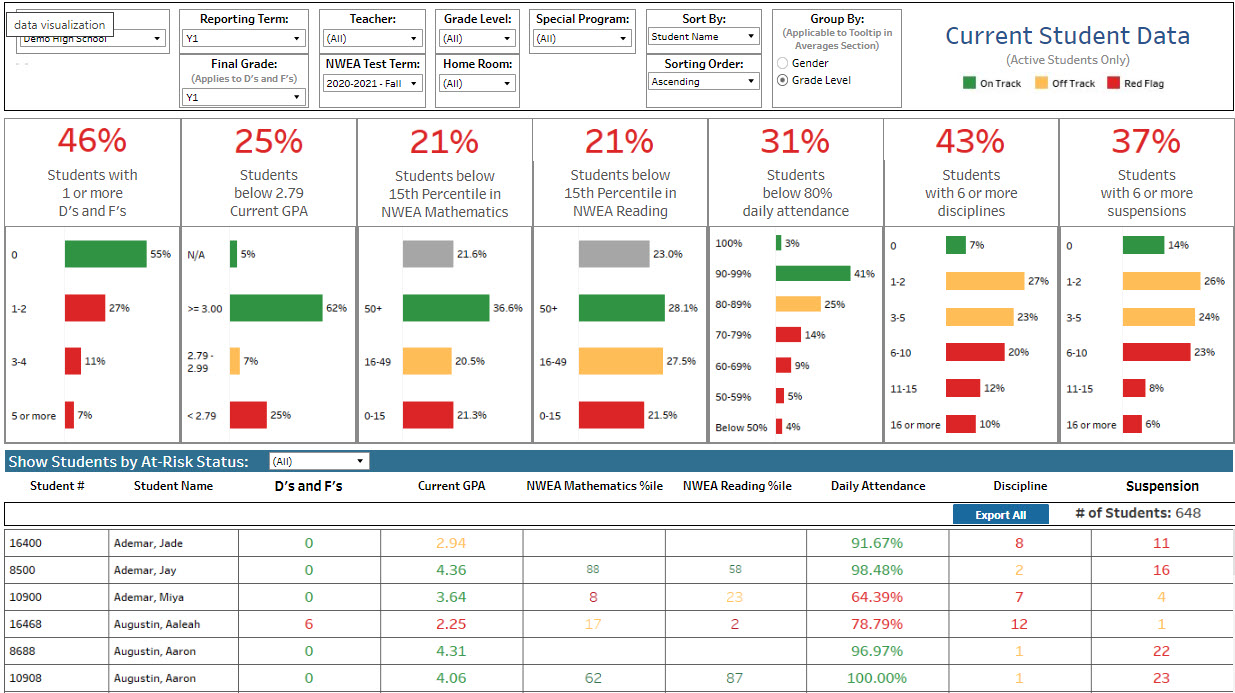
Additionally, when helping students stay on track toward promotion and graduation, it is important to be able to address any needs quickly. Early warning advisory dashboards can provide educators with the “indicator lights” needed to signal a need for support before it may be too late in the semester. Color-coded metrics to demonstrate when a student is on-track or getting off-track can quickly trigger specific interventions, and progress can be monitored over time.
And while our focus is on ensuring no students slip through the cracks in a given school year, it is also important to be able to recognize when students are exceeding expectations or making demonstrable progress. Dashboards can help advisors find areas to celebrate with students in order to help them maintain their progress and feel confident in their ability to stay on track toward grade-level promotion and graduation [1].
Help unite your staff toward student promotion and achievement.
Educators within a school can operate on their own distinct islands. Teachers prioritize student grades and academic achievement, while counselors may focus on attendance and social-emotional development, and administrators are often focused on responding to behavioral incidents. Each role serves a necessary purpose that, together in an advisory capacity, helps support student progress and achievement. Empowering your staff to see the full picture and have access to all of the data they need in an instant can help ensure your students have a smoother journey through the school year and the support they need to achieve their goals.
[1] https://www.ncld.org/reports-studies/forward-together-2021/positive-behavior-strategies/