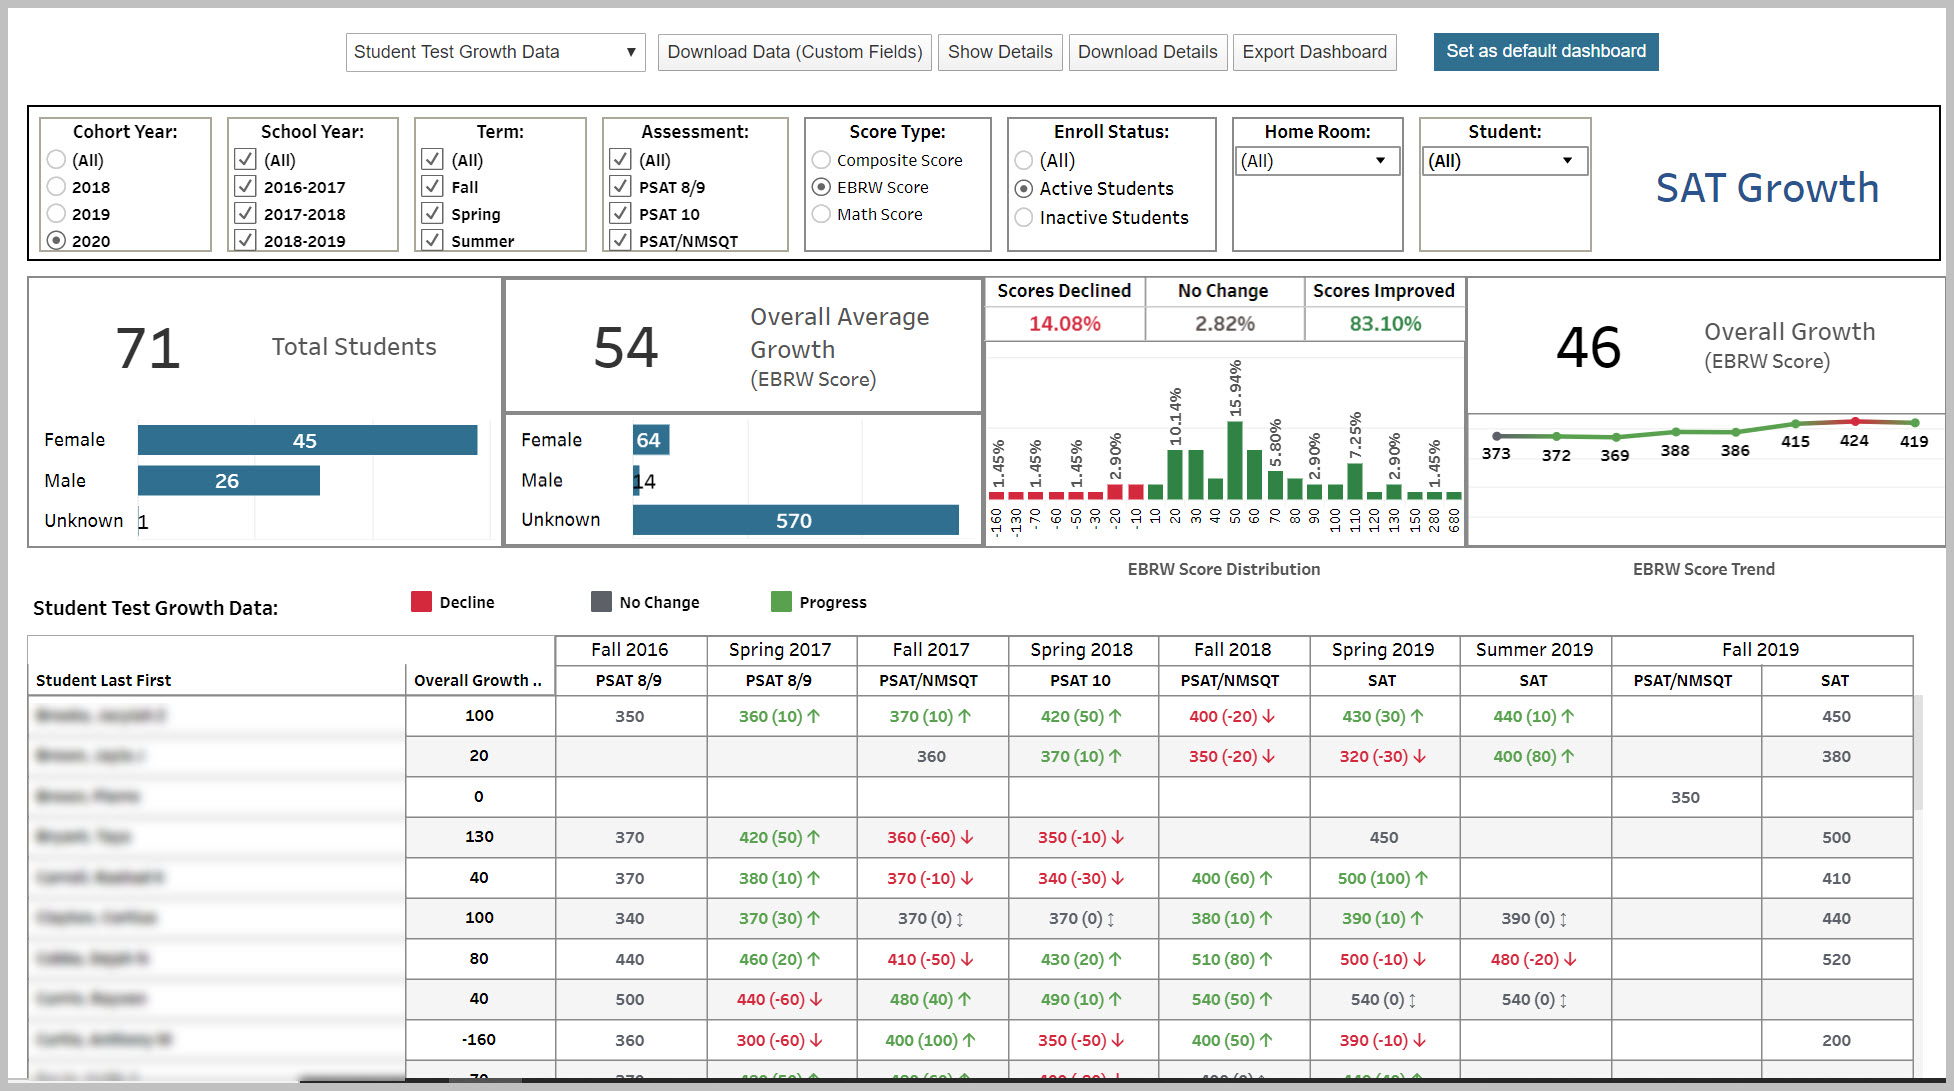
We can connect your PowerSchool SIS with College Board to measure SAT growth over time. Empower your users to quickily review assessment data and make informed decisions.
 |
 |
- Our PSAT/SAT growth over time dashboard allows greater analytical capabilities by providing deeper drill-down options into your
student’s data. - With this platform, you’ll be able to:
- Make testing data more accessible to staff and stakeholders to make informed decisions.
- Know your school-wide, grade level, and group average scores.
- Track students who are not meeting benchmarks and detect patterns for improvement.
- Easily export data for additional analysis.
For questions about the dashboard, please reach out to us.
Our K-12 data analytics tool is designed to answer specific question, improve school performance and provide a total visibility into your data:
PureData uses district data from PowerSchool, Naviance, Salesforce, College Board, NWEA Map, Google sheets and other data sources to help you understand data more deeply, see the big picture, and take action.
Since the launch of our data platform we have designed several dashboards around key areas such as Early Warning, attendance, discipline, grades and enrollment. All our dashboards are 100% customizable and we can build dashboards per your need with no additional cost.


