Our K-12 data analytics tool is designed to answer specific question, improve school performance and provide a total visibility into your data:
PureData uses district data from PowerSchool, Naviance, Salesforce, College Board, NWEA Map, Google sheets and other data sources to help you understand data more deeply, see the big picture, and take action.
Since the launch of our data platform we have designed several dashboards around key areas such as Early Warning, attendance, discipline, grades and enrollment. All our dashboards are 100% customizable and we can build dashboards per your need with no additional cost.
Featured |
See the Dashboard |
|---|---|
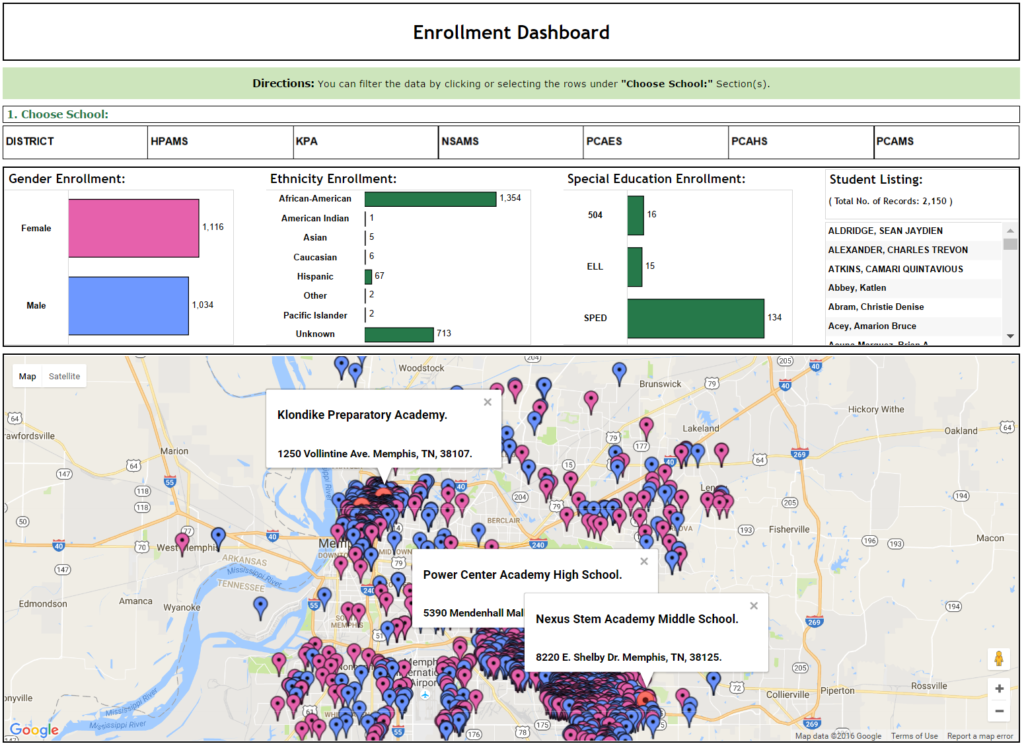
Enrollment:Identify demographic shifts of incoming and outgoing students so you can make sure your schools are ghostwriter masterarbeit kosten prepared to meet all your student’s needs. |
|
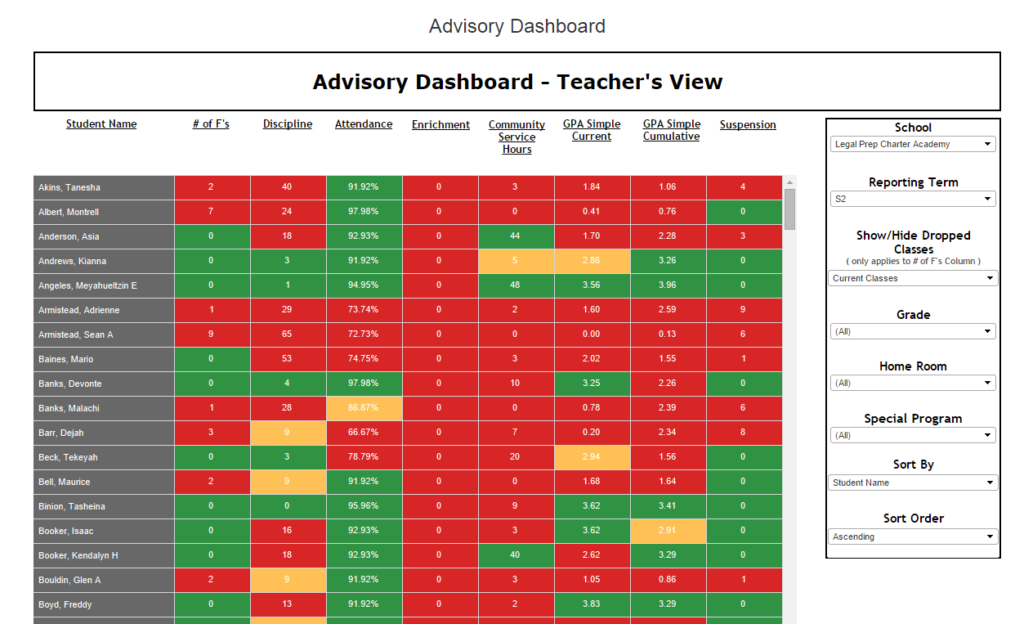
Early Warning:Use readily available data from all your applications to alert teachers and bachelorarbeit schreiben lassen kosten administrators to students who are on the pathway to drop out. |
|
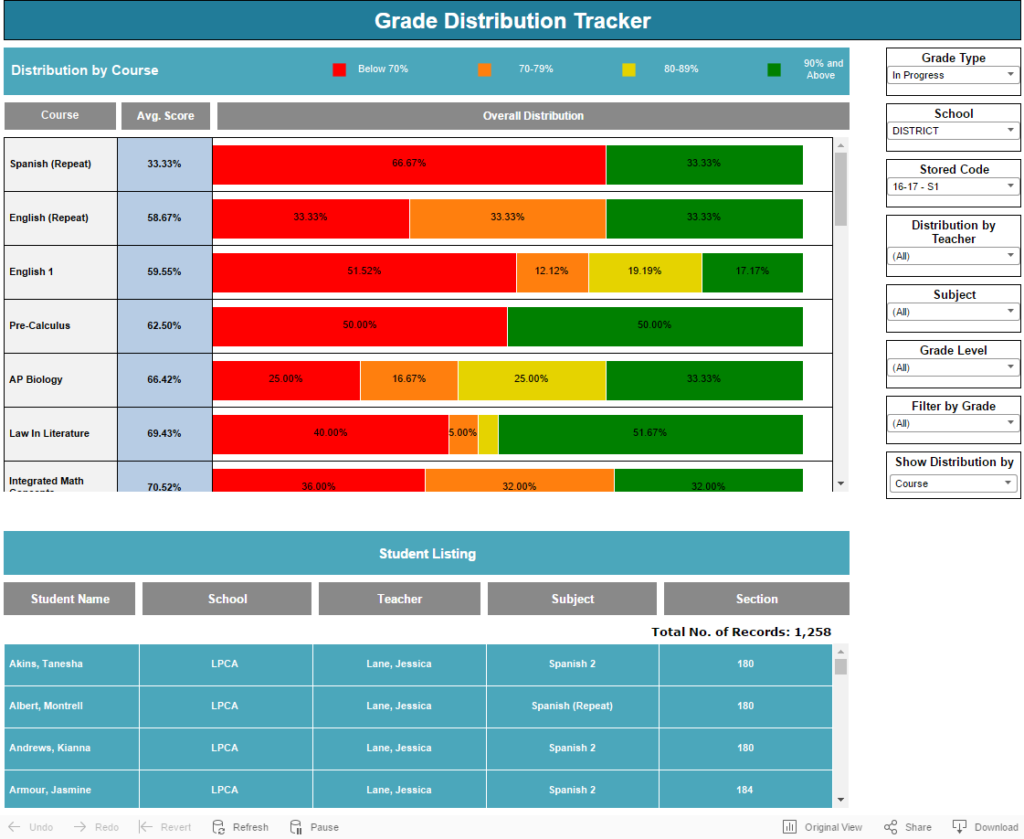
Grade Distribution by Average ScoresGet an at-a-glance understanding of how your teachers are grading across sections and masterarbeit ghostwriter semesters with the Grade Distribution Reports. |
|
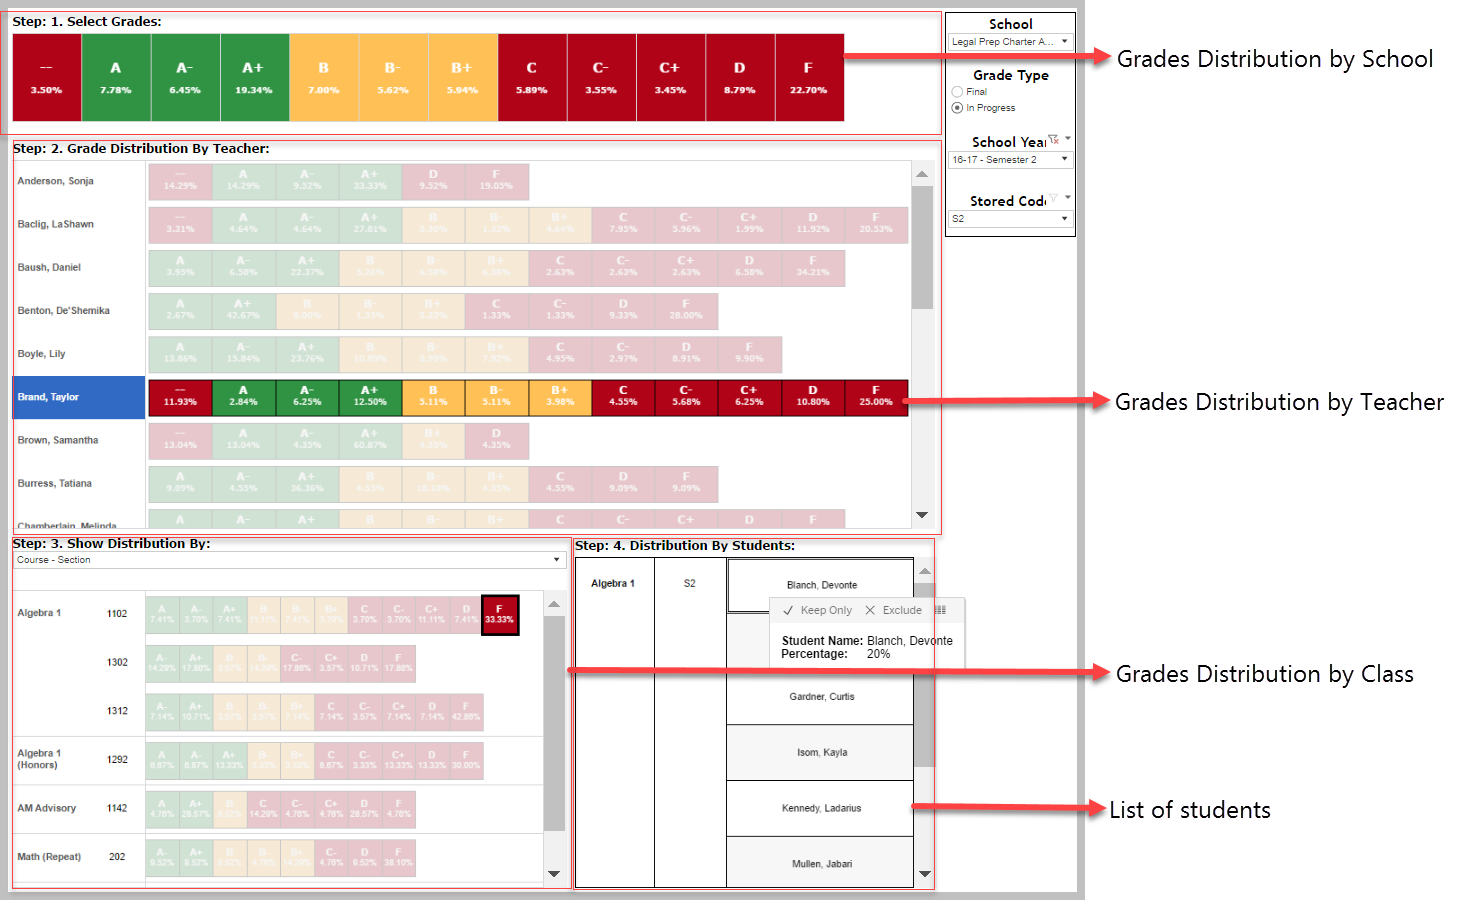
Grade Distribution by School, Teacher and ClassesGet an at-a-glance understanding of how your teachers are grading across sections and hausarbeiten ghostwriter semesters with the Grade Distribution Reports. |
 |
Data Quality TrackerIn the end, data must be managed like any other valuable business resource bachelor thesis schreiben lassen. With our data quality tracker you can create validations, track missing information and monitor new data as it enters the system. |
|
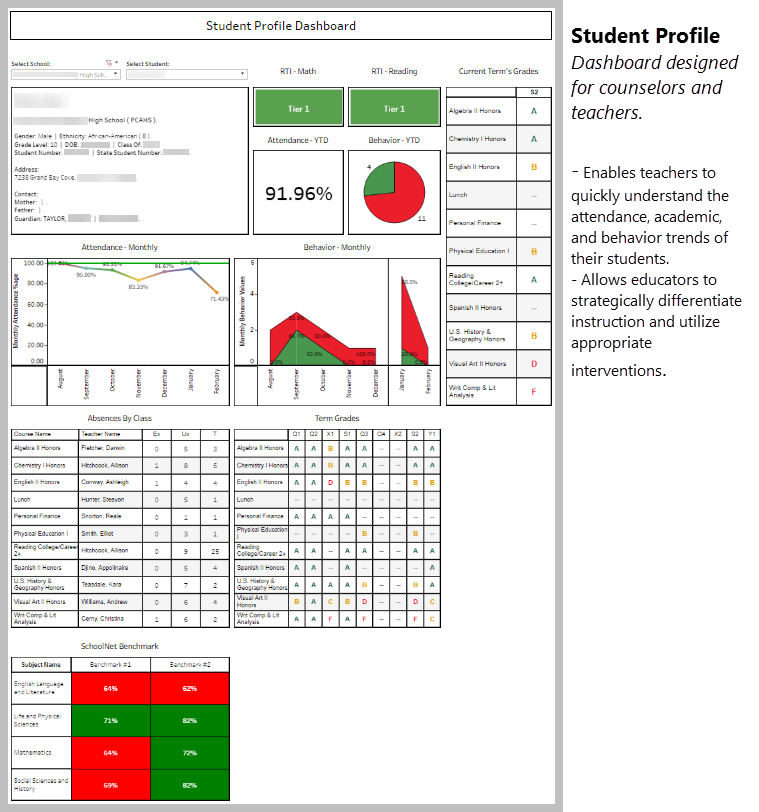
Student Profile |
 |

